(82) CT Dosimetry for Radiopaque Y90 Microspheres - Impact of Image Noise On Dose Accuracy
Saturday, October 18, 2025
6:00 PM - 7:30 PM East Coast USA Time
Courtney Henry, PhD – Medical Physicist, Medical Physics, Dalhousie University; Cheenu Kappadath, PhD – Medical Physicist, MD Anderson; Andrew Kennedy, MD, FACRO – Physician-in-Chief, Radiation Oncology, Sarah Cannon Research Institute
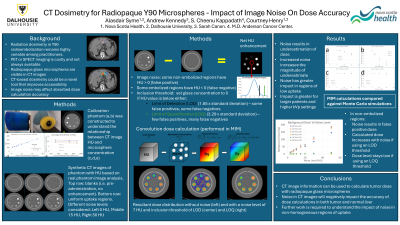
Purpose: Radiopaque glass microspheres for liver radioembolization can be directly visualized on CT imaging. This may provide a novel method of absorbed dose calculation. This study investigates the impact of CT image noise on the dose calculation accuracy of radiopaque Y90 glass microspheres in a phantom model.
Material and Methods: A calibration phantom was constructed with 7 tissue-mimicking resin posts containing radiopaque glass microspheres (1 mg/ml – 25 mg/ml). CT images of the phantom were acquired to generate calibration curves to relate a change in HU to a change in glass concentration. Synthetic CT images in the same geometry as the phantom were created in Matlab with variable amounts of noise (standard deviations ranging from 0 – 50 HU). Mean HU values in the post regions were matched to the values from the scans of the real phantom. Additional images of the phantom were created with identical noise levels but no posts. These images were subtracted from synthetic CT images to produce net HU enhancement levels. A thresholding approach was used to reject noise that could lead to false positive activity assignment. Inclusion thresholds of 1.65 and 3.29 times the standard deviation of the noise were studied. Voxels with net HU values in excess of these thresholds were assigned activity levels based on the calibration curves. Doses were calculated using a Y90 convolution kernel. These results were compared to Monte Carlo (MC) simulations performed with the TOPAS platform which were taken as the “ground truth”. Calculated doses were expressed as a fraction of MC simulated doses.
Results: Image noise led to underestimates of doses. The magnitude of the underestimation increased with noise level. Higher microsphere concentrations were less sensitive to this effect. For example, with a concentration of 3 mg/ml, the calculated doses were within 10% of the MC simulated doses for noise levels up to 10 HU when the lower inclusion threshold was applied but were 60% lower than the MC simulated doses when the higher inclusion threshold was applied. At a concentration of 10 mg/ml, calculated doses were within 5% of MC simulated doses for both inclusion thresholds. Additional work is required to understand the impact of glass concentration heterogeneity within a region.
Conclusions: The current work helps illustrate the importance of optimizing CT imaging protocols to minimize the impact of image noise on CT-based dose calculations.